


In a new extension of the Cardiovascular model we have explored the possible collaboration of arterial acceleration on the one hand and the release and spread of endothelium derived relaxing factor (EDRF) on blood circulation within a confined tree of branching arteries. These arteries have been modeled by capacitances connected with resistances. The first simulation demonstrates how the pulsatile signal of heart contraction in the more proximal branches is transformed to a continuous flow in the most distal branches.
The explanation for this is that any volume of blood driven into the capacitance on the left has three options: 1. remain in this capacitance, 2. flow over a resistance into the next capacitance up right or 3. flow over a resistance into the next capacitance down right. During systole blood is temporarily stored in the capacitance and is released during diastole. Since in a steady state total blood flow at the left (systole plus diastole) equals the summed capillary outflow at the far left, the temporary storage of volume during systole followed by its gradual release during diastole causes dampening of the outflow at every additional node of the arterial tree.
The second simulation shows that an increase in tissue pressure is an important obstacle for the non-pulsatile flow at the level of the capillaries. Blood flow will chose the path of least resistance and can easily bypass segments of the arterial tree under less favourable conditions.
The third simulation shows how arterial acceleration enhances pulsatility of capillary outflow. In the model arterial acceleration is simulated by a temporary and shortlasting decrease in capacitance at stroke onset, causing the capacitance to resist expansion for a brief moment in time. In the model the triggering of arterial acceleration is synchronous for all capacitances from left to right, forcing blood out of the arterial tree during the first 100-150 ms of each heart beat.
Thereby, arterial acceleration augments the increase in intraluminal pressure at stroke onset (upstroke) which is thought to result in the release of EDRF. In the simulation more EDRF is indicated by a more intense yellow colour. After turning the arterial acceleration on, its effect on blood flow and on the production of EDRF is shown by a systolic peak during early systole and a pulsatile colouring of the arterial branches. EDRF is a free radical (with chemical formula NO or nitric oxide) that is deactivated ultrafast. In the model the tau of exponential decay is set to 3 s, meaning that the concentration is reduced to a factor 1/e within 3 s. So, EDRF has little chance to build up in the capacitances and its concentration will modulated synchronously to the beating heart.
Arterial acceleration has more penetration power, meaning that it is more likely to persist when tissue pressure increases. This too is modeled by selecting nodes in the arterial tree (turning to orange), selecting tissue pressure on and gradually moving the slider mid below to the right. As explained elsewhere on these pages, the increase in tissue pressure makes the flow velocity signal more Sys1 (= arterial acceleration) dominant.
With arterial acceleration active, the flow velocity waveform changes from Sys2 exclusive at the far left, via Sys2 dominant, Sys12 balanced, Sys1 dominant to Sys1 exclusive in the nodes with increased tissue pressure at the far right.
In the case of increased tissue pressure, arterial acceleration may overcome the resistance to blood flow. However, when nothing further happens, tissue perfusion remains fully dependent on arterial acceleration. This is where EDRF comes in: tissues at elevated tissue pressures will still receive the Sys1 pulse of arterial acceleration. With the heart pulse meeting a higher resistance to flow, more EDRF will be released and transported into the distal branches by a wave of arterial acceleration. Now EDRF instigates dilatation of these more distant arterial branches allowing blood to flow in during also late systole and diastole. This is demonstrated in the next simulation.
In this simulation the release of EDRF is correlated with the strength of arterial acceleration. This is demonstrated by the simulation below. When arterial acceleration increases it also increases EDRF causing vessels to open up and allow the arterial acceleration to reach into the vessels further downstream. This makes the combination of arterial acceleration and EDRF even more potent in allowing blood to flow into distal capillary systems than arterial acceleration alone.
On a larger scale this explains how the combination of arterial acceleration and EDRF work together to make blood flow within the arterial branches more homogenous: when a large resistance to blood flow is met, more EDRF is produced and transported into the more distal branches by a wave of arterial acceleration, whereas a low vascular resistance causes less production of EDRF, allowing more distal branches to increase their resistance. This is simulated below. Different nodes have been selected with an increase in tissue pressure. It shows how the release of EDRF opens up some and closes down other distal branches of the tree.
Intracranial hypertension is an important obstruction to intracranial blood flow. At moderate intracranial pressure (ICP) elevation the pulsatility of the middle cerebral artery flow velocity increases. This is expressed in the pulsatility index or PI, but also in the difference between Sys1 and Sys2.
The PI has an important drawback: it varies with heart rate. Schaafsma (2012) has, therefore, advocated to use a diastolic flow velocity with a fixed time with respect to stroke onset. Somewhat arbitrarily the D560 was chosen: the average flow velocity calculated over an interval of 80 ms around 560 ms after stroke onset. This allowed D560 to be calculated down to a pulse interval of 600 ms, which equals a heart rate of 100 BPM. At higher heart rates the interval of 80 ms was shifted forward so that it was safely based upon diastolic flow.
Since Sys1 is based upon arterial acceleration (Schaafsma 2014) it is relatively resistant to an increase in ICP, whereas the ejected stroke volume (Sys2) and diastolic flow are negatively affected, the blood being forced into other parts of the circulation where output resistance is less. This explains why the difference of Sys1 minus Sys2 becomes larger, especially when compared to the systemic blood pressure by calculating the ratio pulsatile apparent resistance (or PaR).
When ICP increases further to levels associated with uncal or tegmental herniation the middle cerebral artery flow becomes pendular: systolic inflow but diastolic back flow and, ultimately, so called systolic spikes may be observed (Schaafsma 2025). These systolic spikes can be demonstrated in Neuromons CardioVascularSimulationApp for macOS, in particular, in the recent extension demonstrating the interaction of arterial acceleration and EDRF.
The Nobel prize awarded discovery of endothelium derived relaxation factor or EDRF, with the chemical formula NO or nitric oxide, made it clear that within tissues micro-circulation is controlled by local factors. The resistance to the blood stream causes shear stress in the endothelium of feeding arteries releasing EDRF to the more distal branches. In this way arteries open when high resistance is met and, presumably, constrict when peripheral resistance is low, for instance, when arterioles open as part of vascular metabolic coupling.
Neuromon's cardiovascular model was expanded with a simulation of the hypothetical combined effect of arterial acceleration and EDRF. It is emphasised that for this purpose the model's parameters were fine tuned in order to meet its desired result: providing graphical imaging to theoretical considerations. The model cannot be calibrated to experimental data, since data describing the relation between arterial acceleration and EDRF are so far unavailable.
Keeping this in mind the video below shows how the pressure wave resulting from the addition of a given stroke volume to the aorta spreads along the branches of the arterial tree without arterial acceleration and without regulation by EDRF. The added volume to the aorta pushes the blood forward into the branches of the arterial tree, resulting in a pulsatile wave that dampens along its course. The viscoelastic properties of the arterial tree prevent the pulsatile energy provided by heart contraction to fully reach into the periphery.
As we have seen, arterial acceleration may promote the pressure wave in reaching periphery, since the presumed shortlisting contraction within the smooth muscle layers of the arterial tree augments the pressure wave generated by heart contraction. Since arterial acceleration is thought to spread as a peristaltic wave along the branches of the arterial tree and distal arteries profit from tension already built up by proximal branches, its effect is expected to become greater towards periphery.
In the video below the effect of arterial acceleration is visible as an increase in pulsatility in the most distal branches. In addition, the steeper onset of the pressure wave is expected to promote the release of EDRF, symbolised by the colour yellow in this video. In the model the amount of EDRF release within a single arterial branch is arbitrarily calculated from the maximal change of pressure (dPdt) in the capacitance one step more proximal. The EDRF is released into the next capacitance leading to an increase in its concentration, but because EDRF has a short half life the colouring of a capacitance to yellow is only short lived.
Local differences in metabolic activity may result in local differences in arteriolar resistance causing inhomogeneities in tissue perfusion. Likewise, the pressure within a tissue is often not evenly spread. This too may cause inhomogeneities in tissue perfusion.
The model was expanded by allowing the inclusion of local tissue pressure. Capacitances can be selected one by one and the model includes the effect of local tissue pressure by adjusting a slider up to 100mmHg max. The effect of this increase in tissue pressure is shown in the video below.
Arterial acceleration may improve the penetration of the pressure wave into tissues with unfavourable conditions, but it does not guarantee adequate blood supply. This is where EDRF comes into play. With the branches of the arterial tree EDRF helps to adjust local arterial diameter to local experienced shear stress.
In the simulation below every resistances adapts to the local EDRF concentration. If EDRF is high there is a pressure build up at stroke onset meaning that blood, despite arterial acceleration blood has difficulty flowing into the periphery. In the model a more distal resistance will be lowered allowing the blood to flow in more easily and reduce the build up of pressure in the more proximal capacitance. When there is little build up of pressure, EDRF will be low, and the model will increase the next resistance.
In the model the resistances are adjusted gradually, changing from one heart beat to another. Small bar graphs centred in each branch represent whether its resistance is higher or lower than its mean setpoint. Resistances are not adapted instantaneously but stepwise from one heart beat to another to avoid oscillations within the model. The bar plots can, therefore, be seen to rise (with their colour turning from green to red) symbolising an increase in resistance and be seen to lower (with their colour turning from red to green) symbolising a decrease in resistance. No bar plot is seen when the resistance is at its means setpoint.
Having seen how EDRF and arterial acceleration are likely to collaborate, another important aspect of EDRF must be emphasised: its intrinsic capacity to homogenise the blood flow within the branches of the arterial tree.
In the simulation below we show how EDRF adjusts resistances (that are not ideally preset) so that minimal pressure build up occurs at proximal branching nodes and blood is allowed to flow downstream with minimal interruption.
In cases of fibrillation or cardiac arrest there is no cardiac output to the brain. At a physiological temperature and without sedation the brain integrity may be preserved for only a few minutes. When resuscitation is effective and leads to a timely recovery of circulation, brain ischemia does not necessarily lead to disability. However, resuscitation may not start straight away and a delay longer than on estimate 6 minutes may lead to permanent brain damage.
Brain ischemia becomes so pronounced that it leads to anoxic depolarisation of neurones. Anoxic depolarization leads to the intracellular cascade of apoptosis and, thereby, neuronal death. Those neurones most active at the moment of circulatory arrest are most vulnerable to permanent damage: usually the hippocampus and cerebellum suffer most from prolonged brain ischemia.
The theory of arterial acceleration gives a new perspective on the aim and technique or resuscitation. When properly executed, cardiac massage triggers the myogenic response in the arterial system, which helps to bring blood into motion in all the body's capillary systems, including the brain. The pressure on the chest wall may additionally result in blood volume being moved to the aorta, but when cardiac preload is low (due to a massive vaso-dilatation resulting from a loss of sympathetic tone) only a limited amount of blood volume may effectively be brought into motion.
Theoretically, cardiac massage should aim to trigger the myogenic response and, therefore, be executed rapidly and in a high frequency. Backflow to the heart may be promoted by lifting the legs or positioning the patient in Trendelenburg, whenever feasible. Artificial breathing only contributes when there is at least some form of blood circulation established.
In the cardiovascular simulation model, cardiac arrest can be simulated by playing off the scenario. Heart massage can be performed by placing the mouse over the heart and making repetitive mouse (or trackpad) compressions at high frequency. When properly executed the arterial Sys1 component can be shown to recur in the signal.
Investigators have recently shown that the Systolic 1 based pulsatile apparent resistance (S1-PaR) is more sensitive to an increase in intracranial pressure than a simple pulsatility index (PI) based upon middle cerebral artery flow velocity (MCAFV) alone. S1-PaR is a so-called blood pressure (BP) corrected PI. It is designed to detect a difference between middle cerebral artery PI and arterial blood pressure PI.
The apparent resistance is defined by aR = BP / MCAFV similar to Ohm's law: R = I / V: resistance is current divided by voltage (difference).
Central to the work of Neuromon B.V. is the theory of arterial acceleration. This theory proposes that the pressure wave of the heart is amplified by a shortlasting contraction in the conducting vessels of the arterial tree: Sys1. The second phase of systole (Sys2) is the result of the stroke volume being ejected into the aorta. The propagation of the Sys1 is presumably faster than of Sys2, since the first is based upon a rapidly spreading depolarization within the smooth muscle cells of the arterial wall via the abundant presence of gap junctions. The propagation of the Sys2 wave is slower since it is dampened by the visco-elastic properties of the arterial tree.
Arterial acceleration increases the penetration force of the Sys1 component, whereas Sys2 and diastolic flow velocity will be more sensitive to intracranial pressure elevation. This is typically the case when systolic spikes are seen in the MCAFV signal: only allowing flow during Sys1 and none during Sys2 and the diastolic phase.
Therefore, the relation between arterial blood pressure and MCAFV will be different during Sys1 compared to diastole. This leads to the definition of the PaR:
S1-PaR = (ED_aR - Sys1_aR) / TAVM_aR (with TAVM as abbreviation for time averaged mean).
The working of this parameter can be demonstrated in Neuromon's cardiovascular simulation. Let's start with simple settings of the model: no reflex activity but with arterial acceleration active.

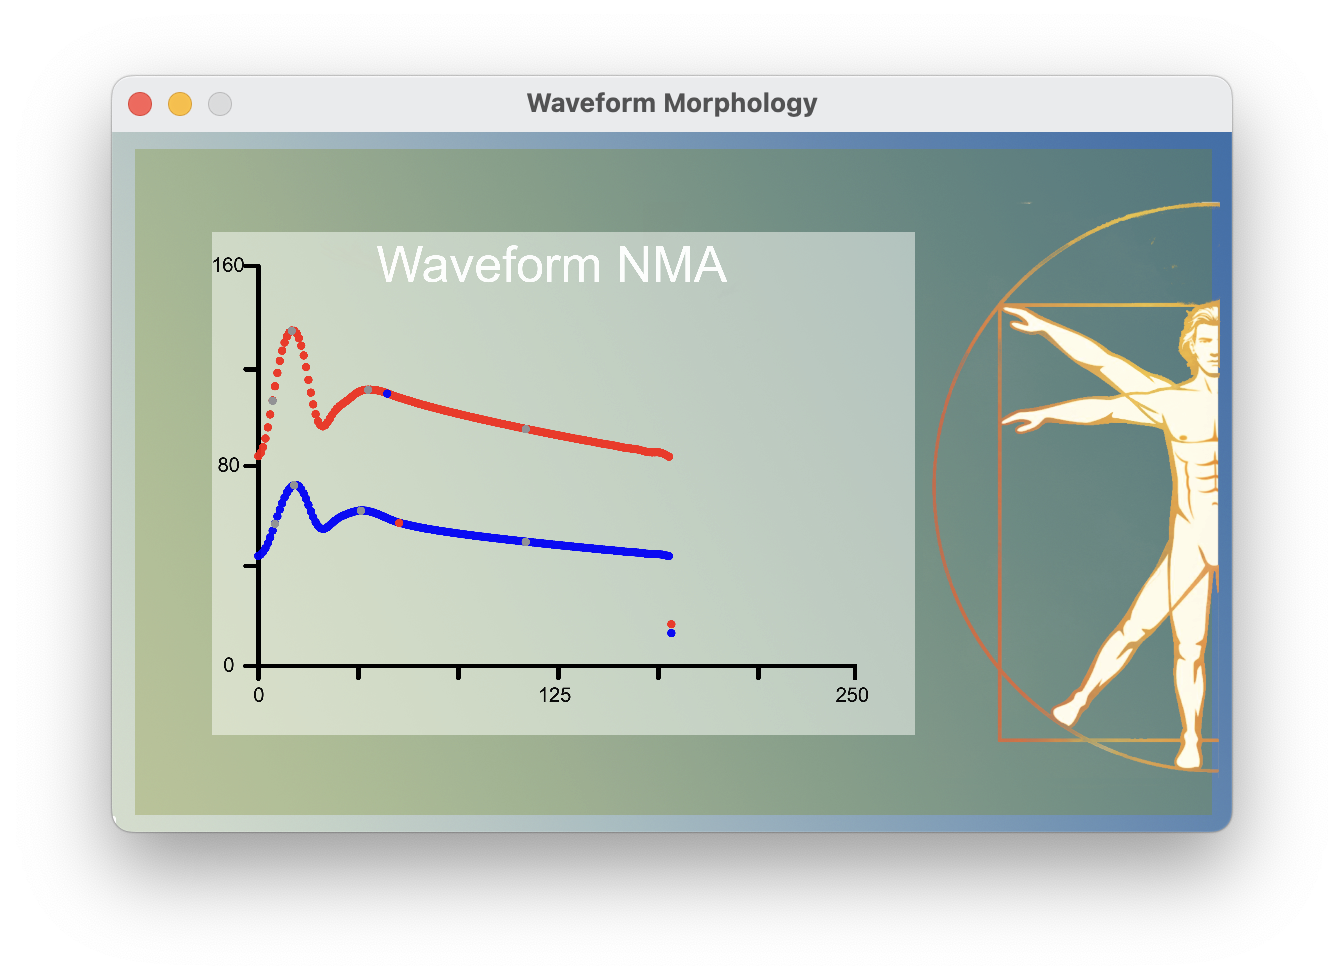
In the simulation (red curve is arterial blood pressure (ABP) and blue curve is right middle cerebral artery flow velocity (MCAFV)):

This gives us the following results:
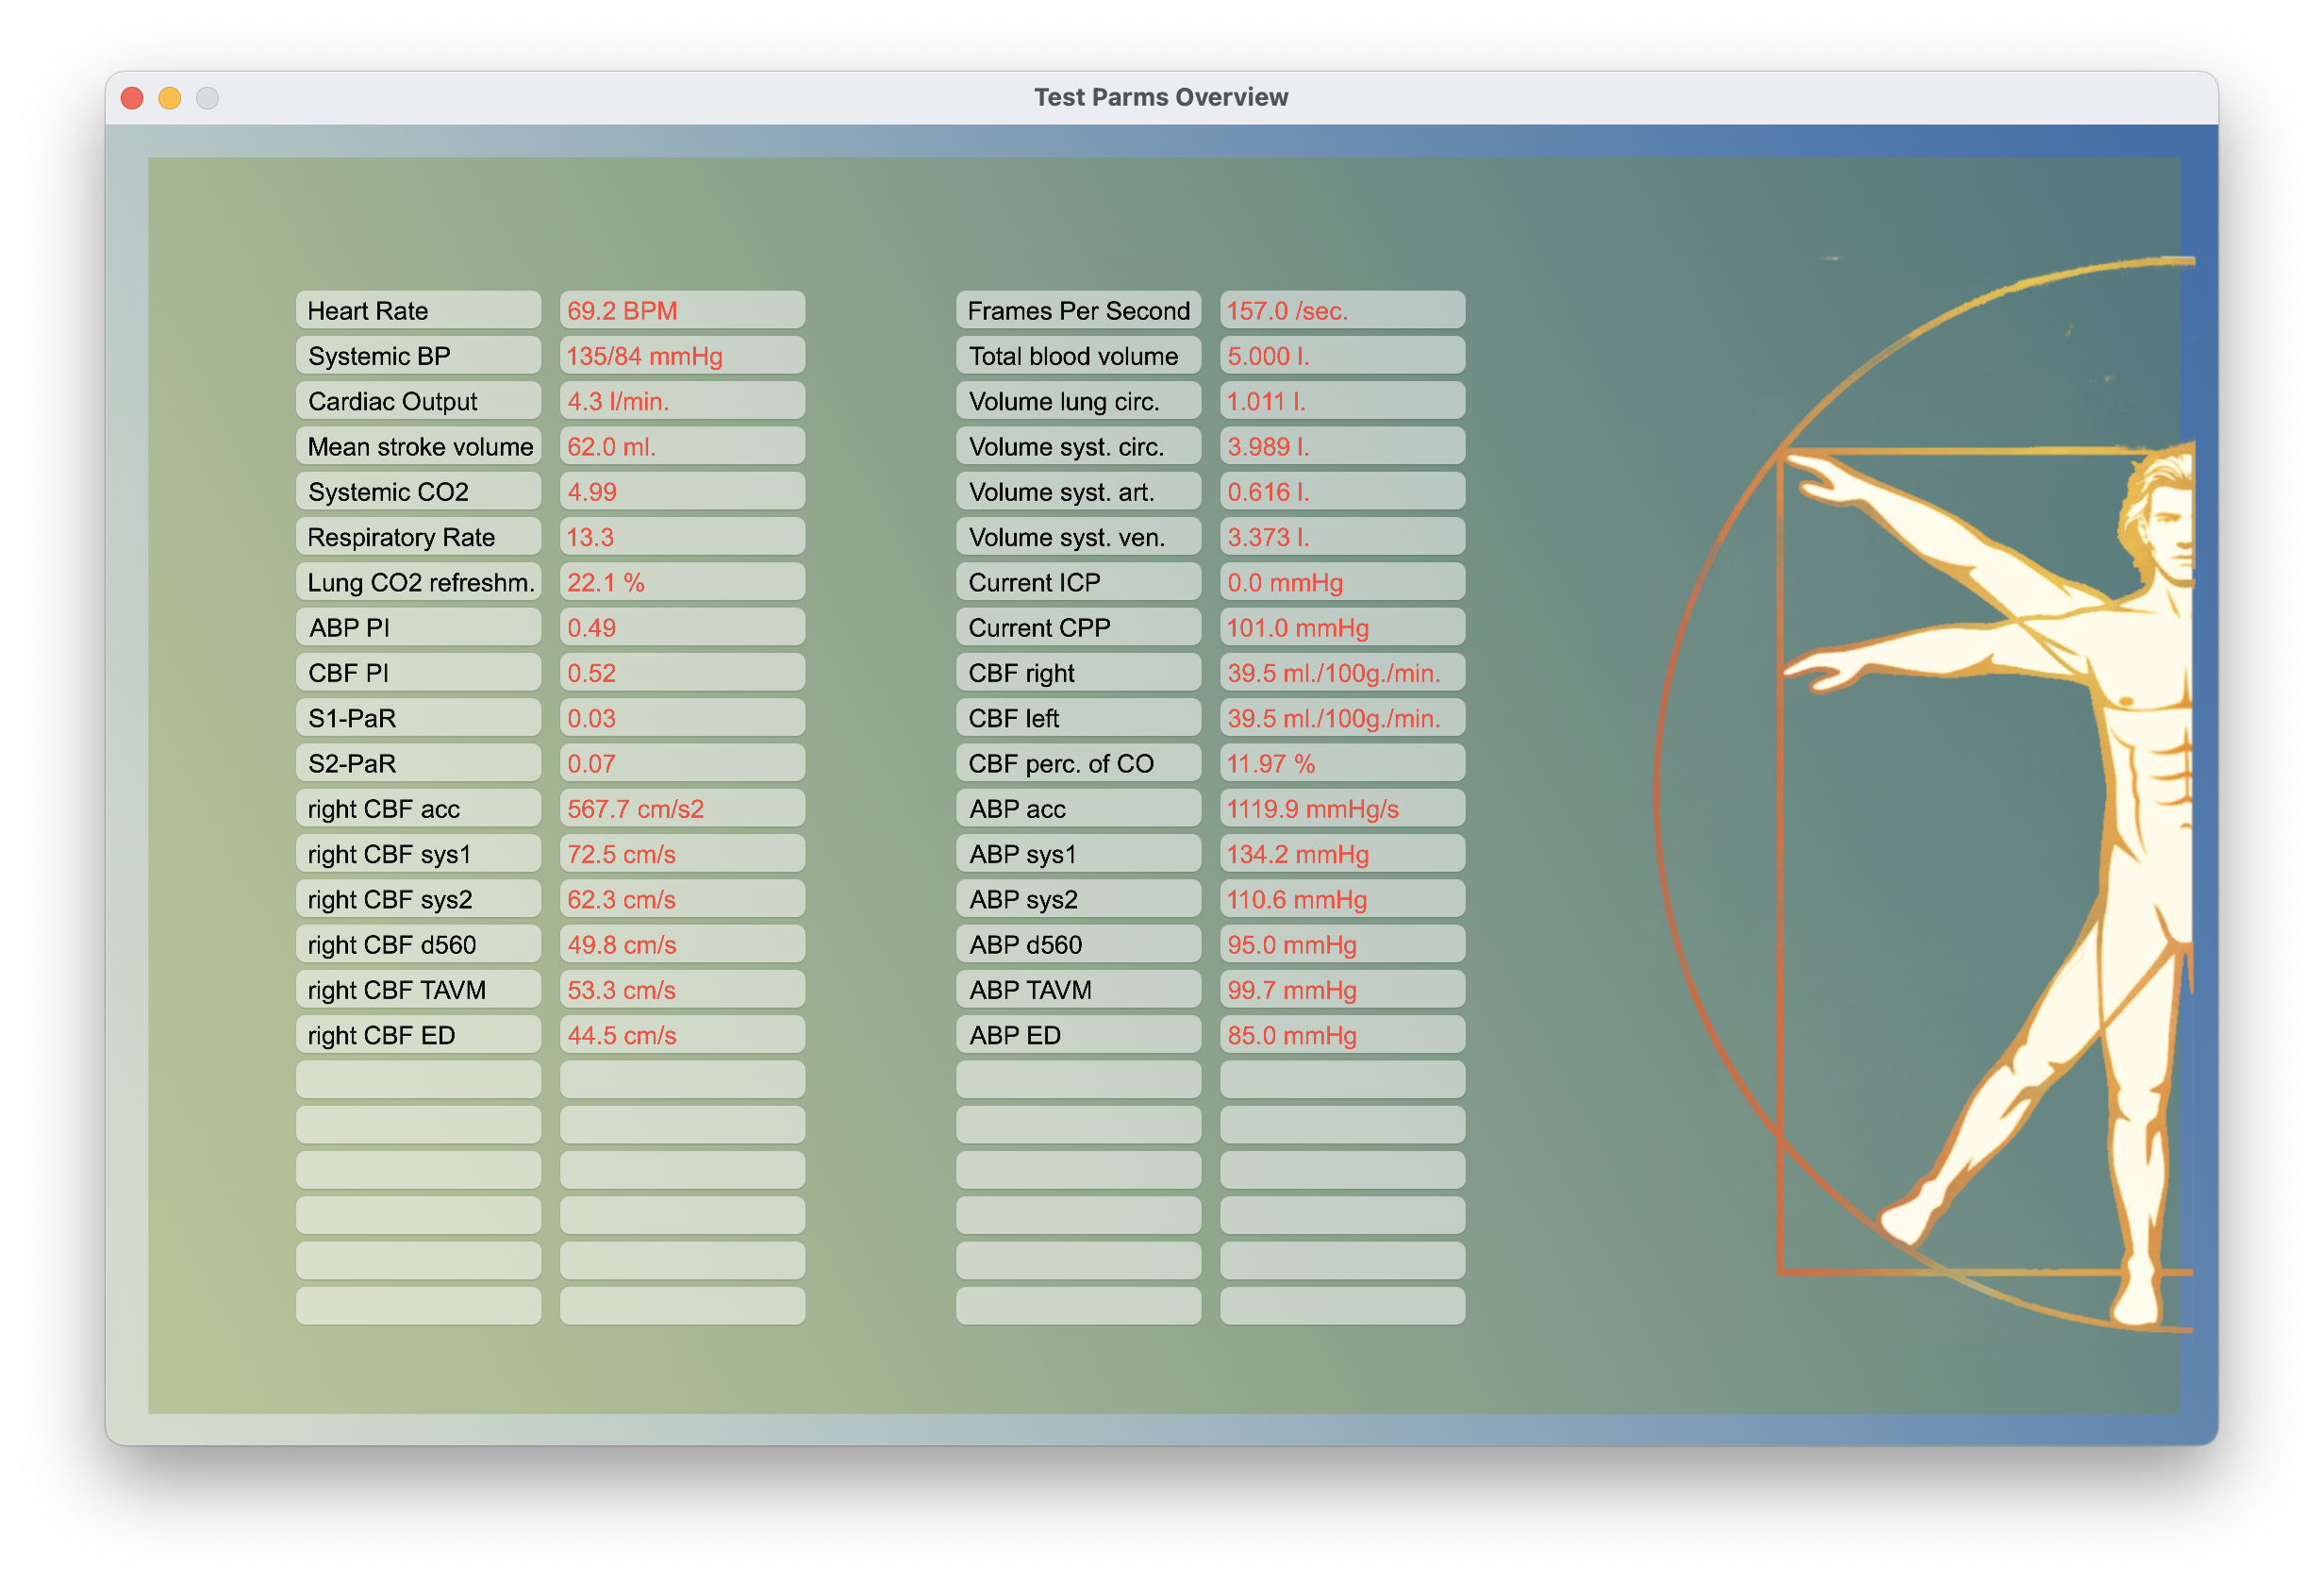
And the following waveforms (red curve is arterial blood pressure (ABP) and blue curve is right middle cerebral artery flow velocity (MCAFV)):
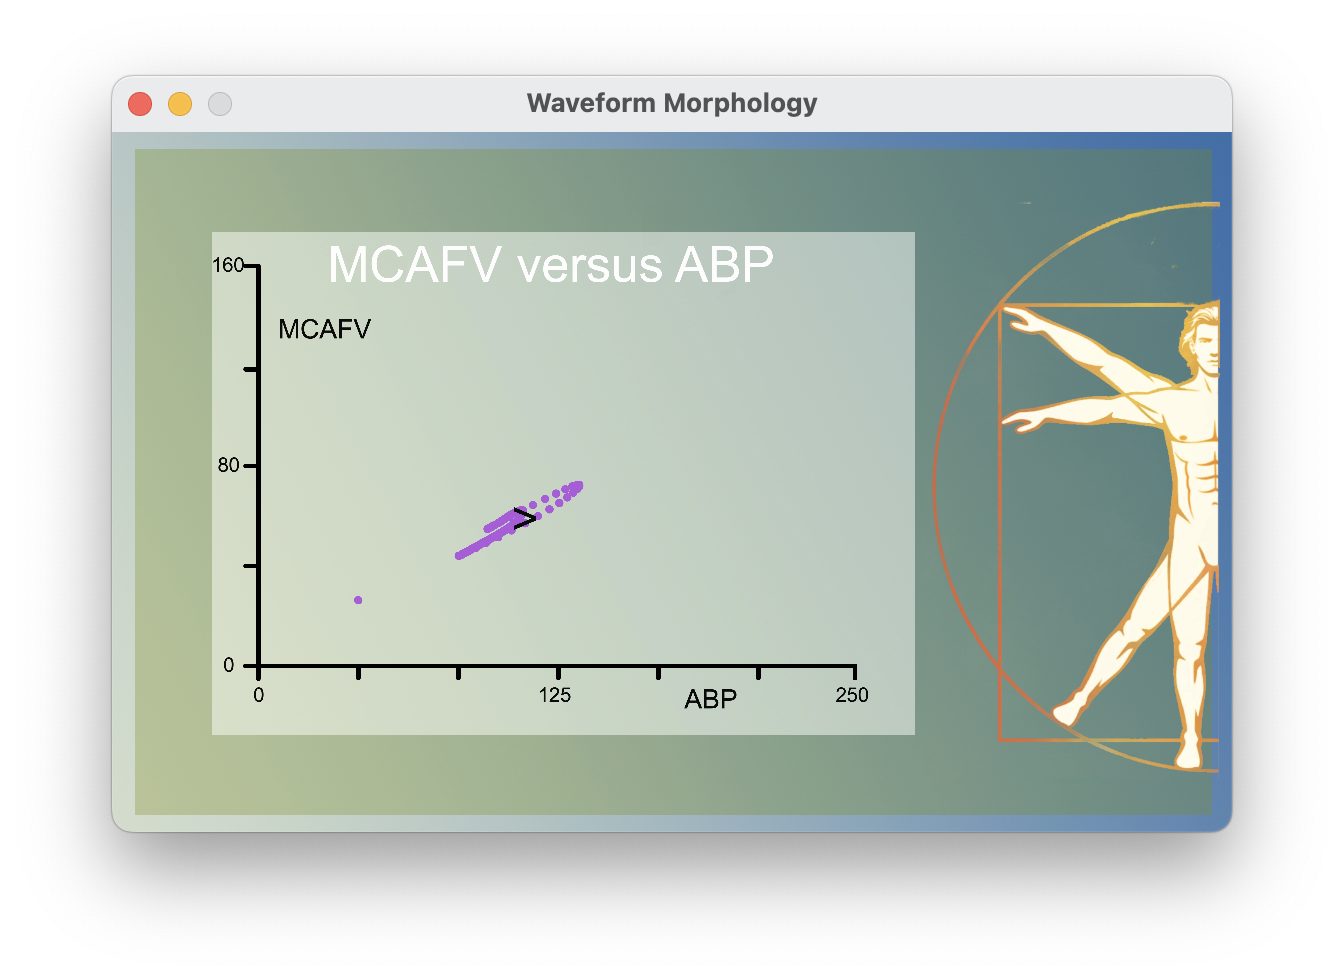
After normalization (dividing both signals by their time averaged means) and swapping the x- and y-axis:
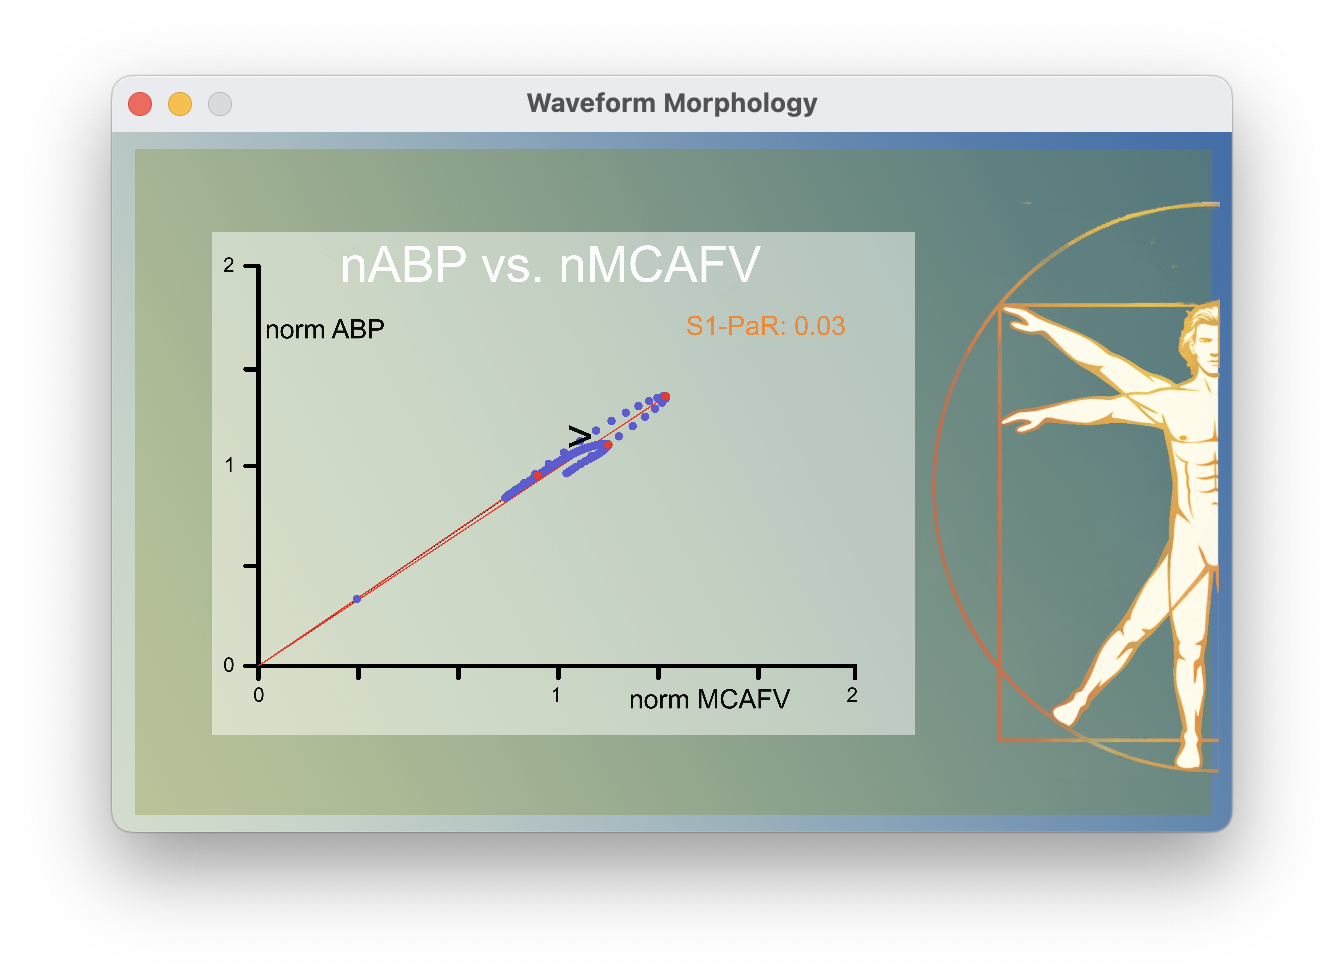
Under these circumstances the relation between ABP and MCAFV (aR: symbolized by the angle of the lines with the x-axis) is similar during systole and diastole. Deviations from the ideal curve are partly due to a time lag between MCAFV-Sys2 in relation to ABP-Sys2. (Note that the pulsatility index (PI) is the width of the graph projected along the x-axis.)
What happens during elevated ICP? In the model ICP is assumed constant and adds up to normal venous pressure lowering the arterio-venous pressure difference that drives the blood flow.. During diastole, the relative effect of elevated ICP is larger than during systole and it may even lead to the cessation of flow at the so called critical closing pressure (CCP). Settings of the model (note: intracranial pressure):

The simulation (red curve is arterial blood pressure (ABP) and blue curve is right middle cerebral artery flow velocity (MCAFV)):

Leading to the following results:
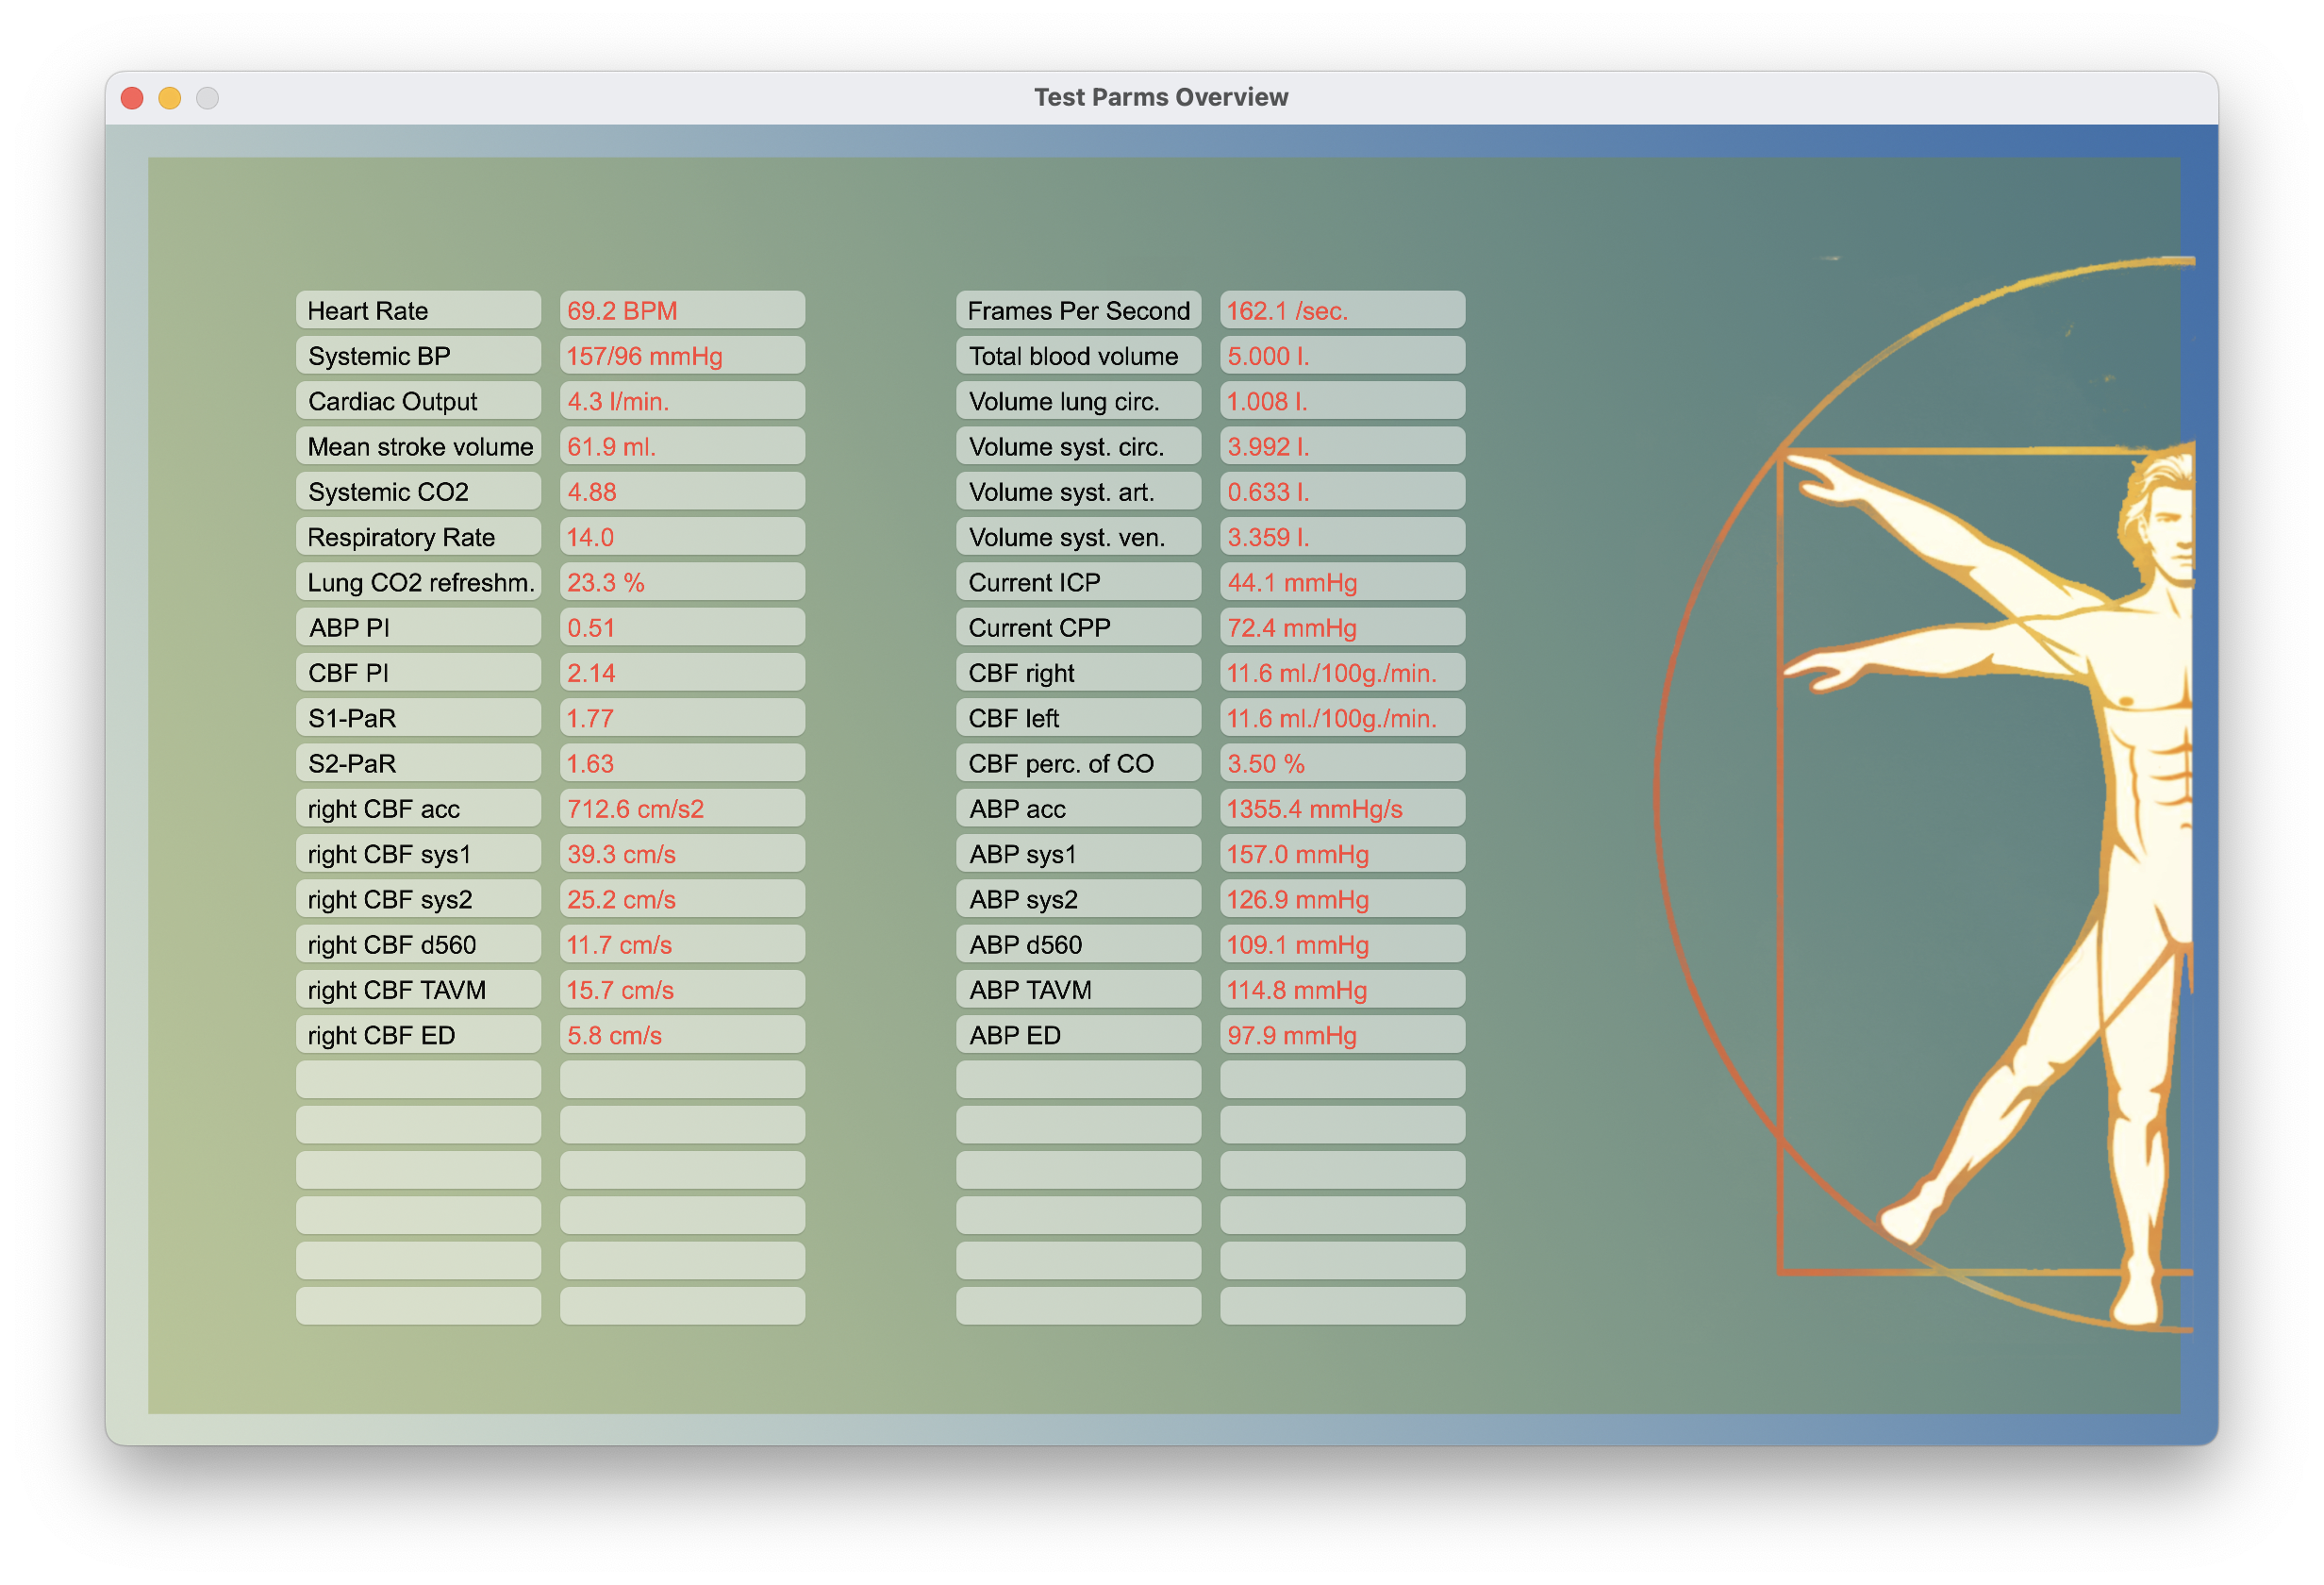
And the following waveforms (red curve is arterial blood pressure (ABP) and blue curve is right middle cerebral artery flow velocity (MCAFV)):
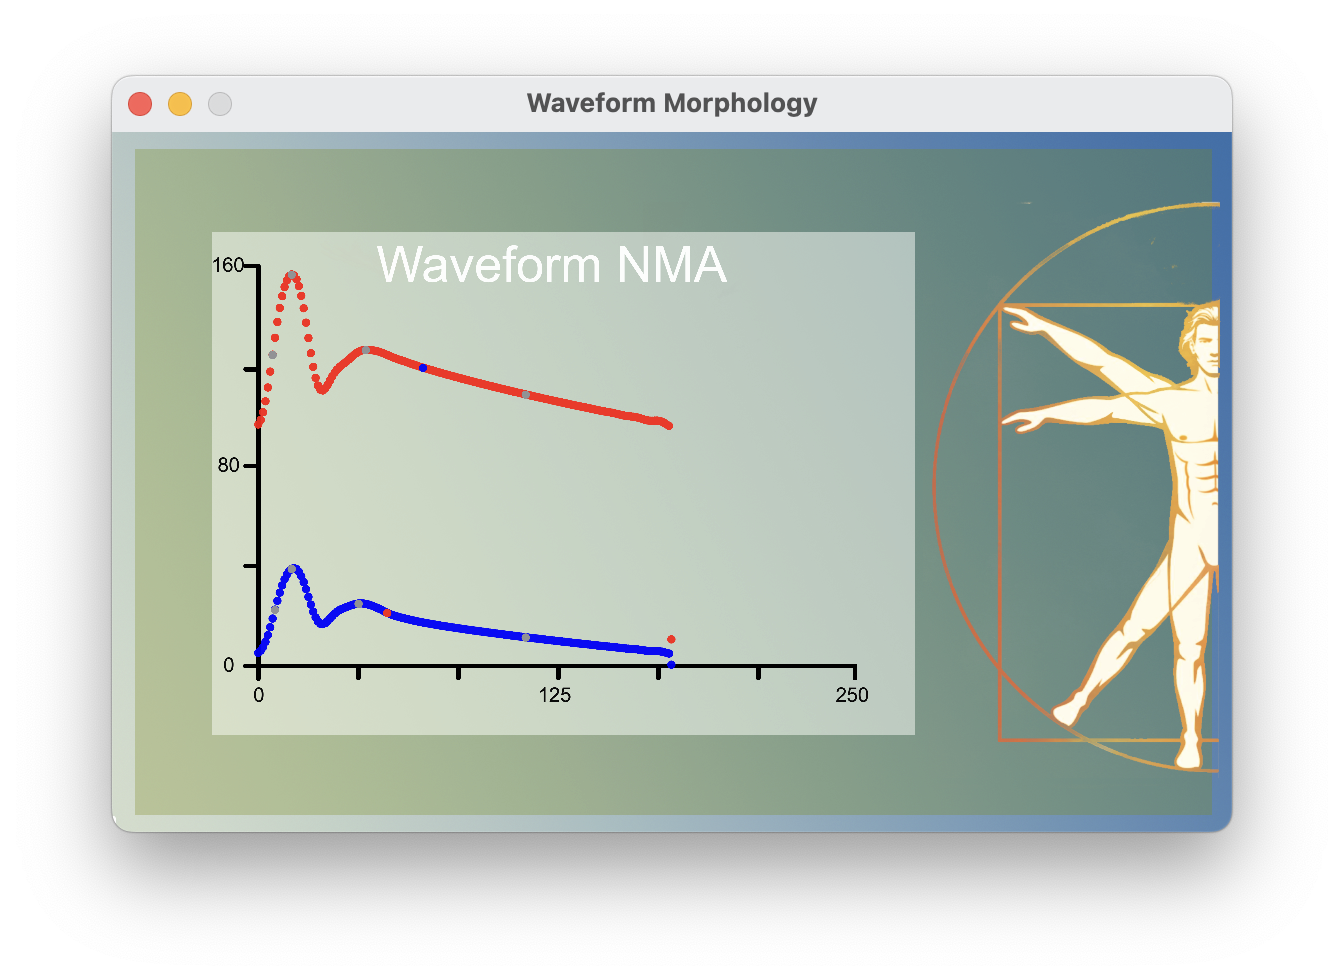
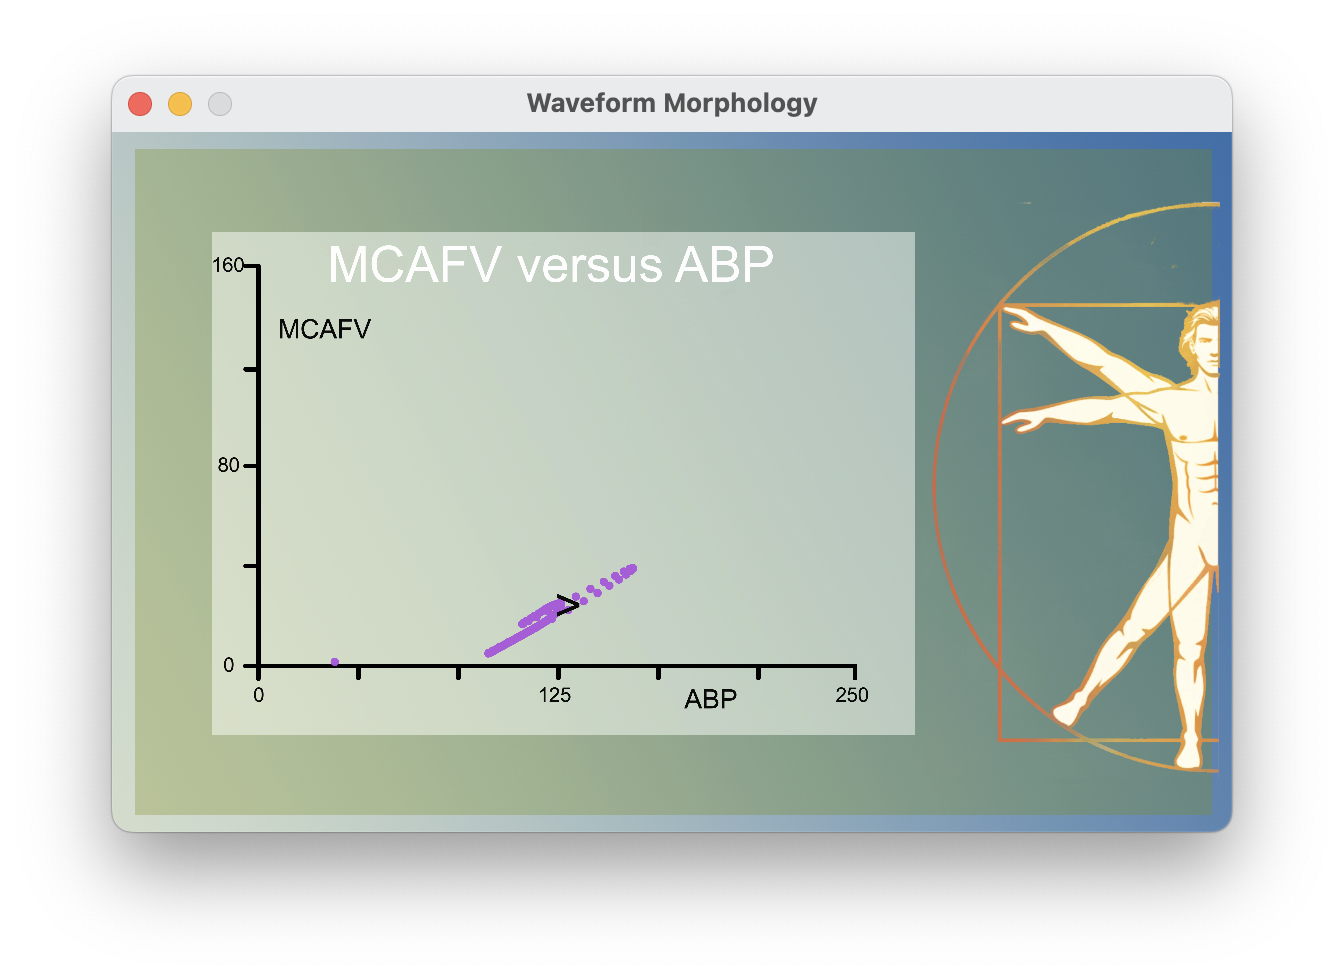
After normalization (dividing both signals by their time averaged means) and swapping the x- and y-axis:
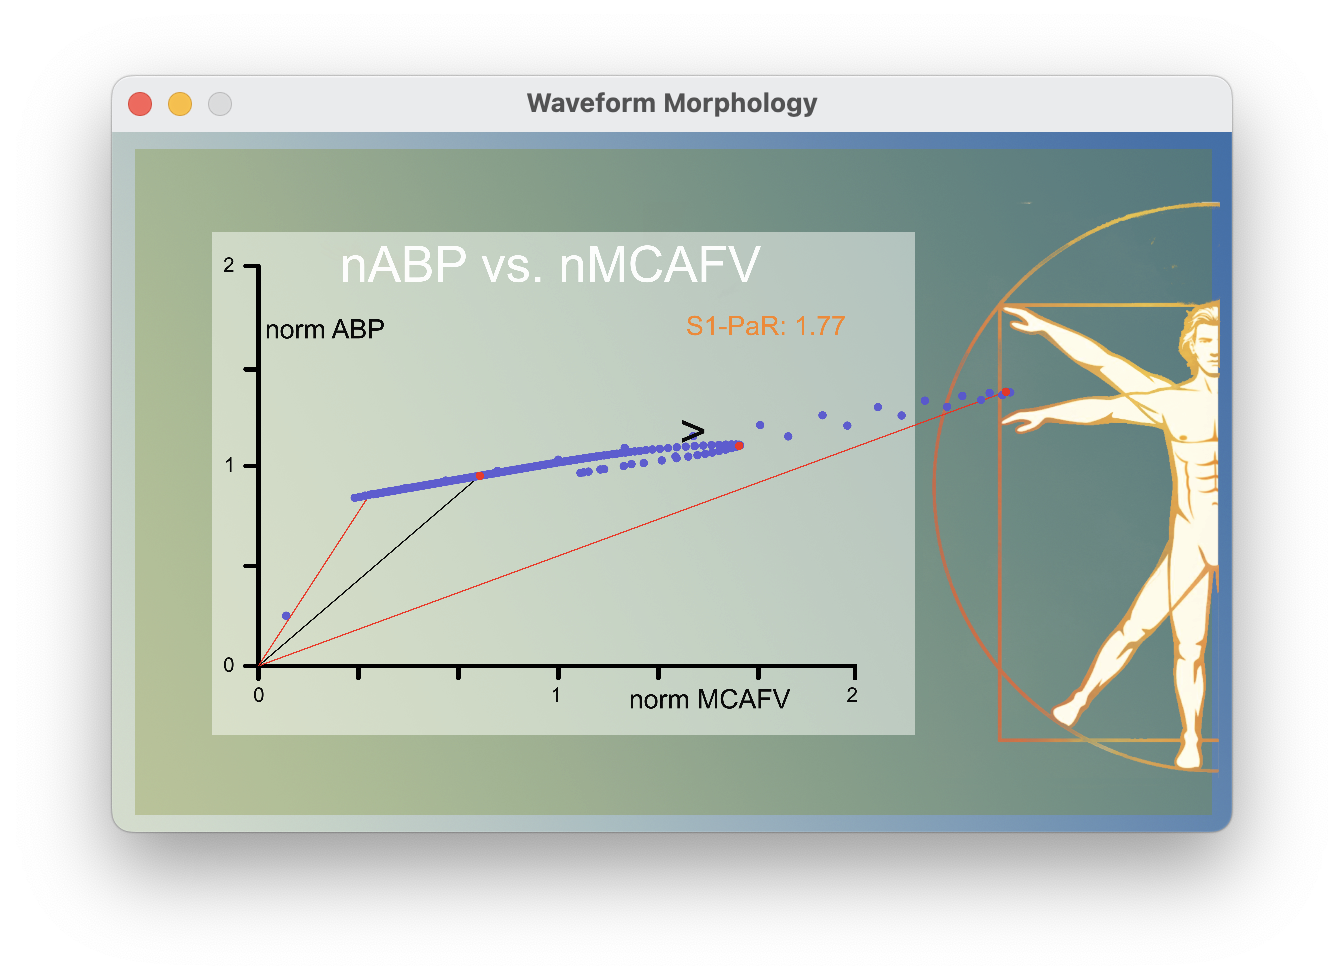
The increase in ICP brings the MCAFV closer to zero and under these circumstances the relation between ABP and MCAFV (aR: symbolized by the angle of the lines with the x-axis) is quite different during systole and diastole resulting in an increased value of S1-PaR. (Note that the PI is the width of the graph projected to the x-axis.)
S1-PaR = (ED_ABP/TAVM_ABP) / (ED_MCAFV/TAVM_MCAFV) - (S1_ABP/TAVM_ABP) / (S1_MCAFV/TAVM_MCAFV)
Comparing different parameters for a range of ICP values:
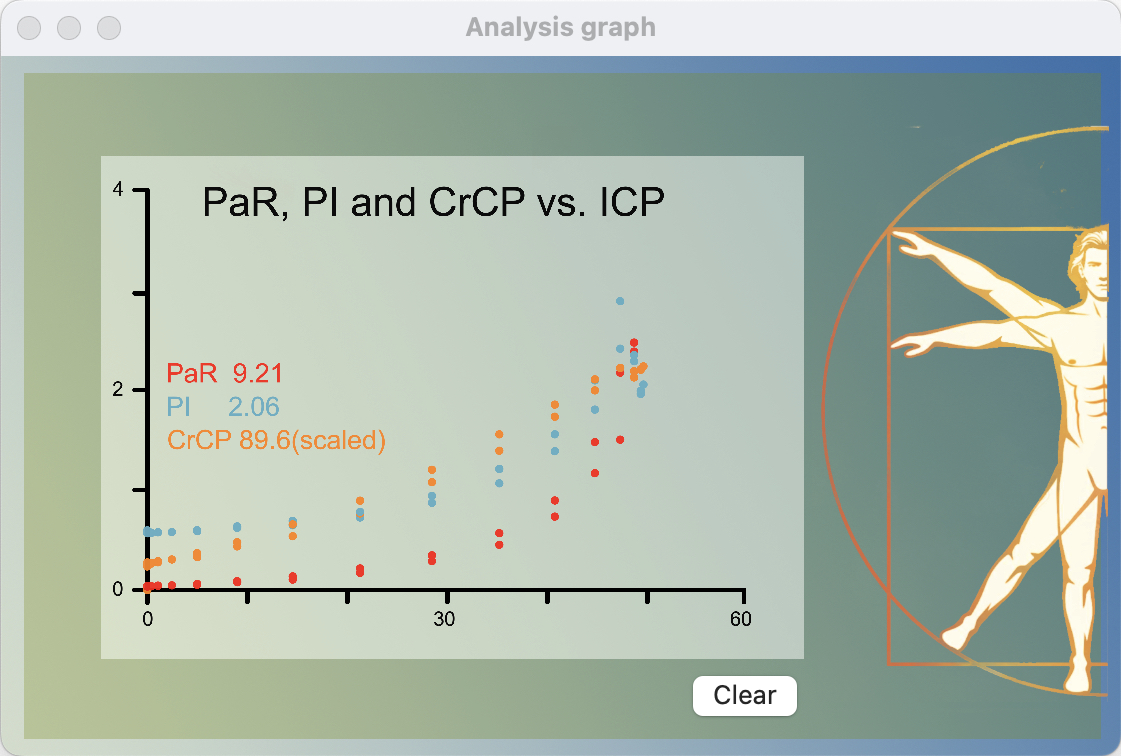
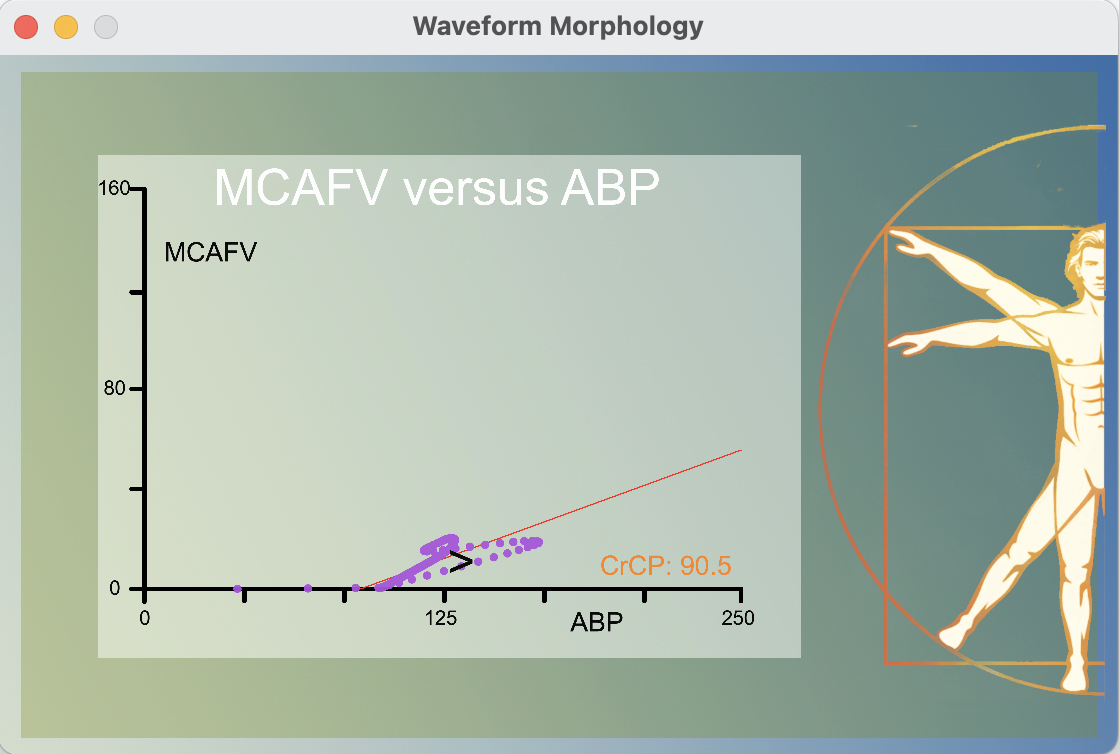
S1-PaR and PI rapidly increase when the end diastolic flow velocity becomes zero (at ICP > 30 mmHg). The CrCP increases more steadily since it is calculated over the full beat to beat average and the effect of the diastolic flow velocity becoming zero is more gradual.
Subcategories
-
IAG

In 2007 Neuromon BV was supported by a grant from the Innovative Action Programme Groningen and the EU.
-
Eureka label

For it's innovative work and collaboration with international partners Neuromon B.V. received the Eureka! label from the EU
-
Collaboration

To the benefit of patients on the Intensive Care Neuromon B.V. has joined forces with Compumedics DWL.
