From heart beat to beat the model calculates cardiac output (in l/min) by multiplying stroke volume (l) times 60 (s) times heart frequency ( which is the reciprocal of heart cyclus duration; 1/s). As output parameter CO is given in a box just below the simulation animation.
With all the model's reflexes turned off and only acceleration and automatic adaptation of respiratory rate turned on, the question arises how to increase CO. Most people would answer by increasing heart rate. But, changing heart rate from 69 to, for instance, 100 BPM increases CO only slightly. The reason for this is that cardiac filling time is reduced: increasing heart rate reduces the duration of diastole more than of systole. Therefore, in order to increase CO, the heart needs to be filled over a shorter period of time. This can be achieved by increasing venous pressure.
Decreasing or increasing venous capacitance directly translates to an increase or decrease in cardiac output. It can be seen as a forced transfer of venous blood volume into the arterial compartment, causing a rise in arterial blood pressure when the peripheral resistance does not change but allowing arterial blood pressure to remain within limits when peripheral resistance decreases, as is the case in physical activity.
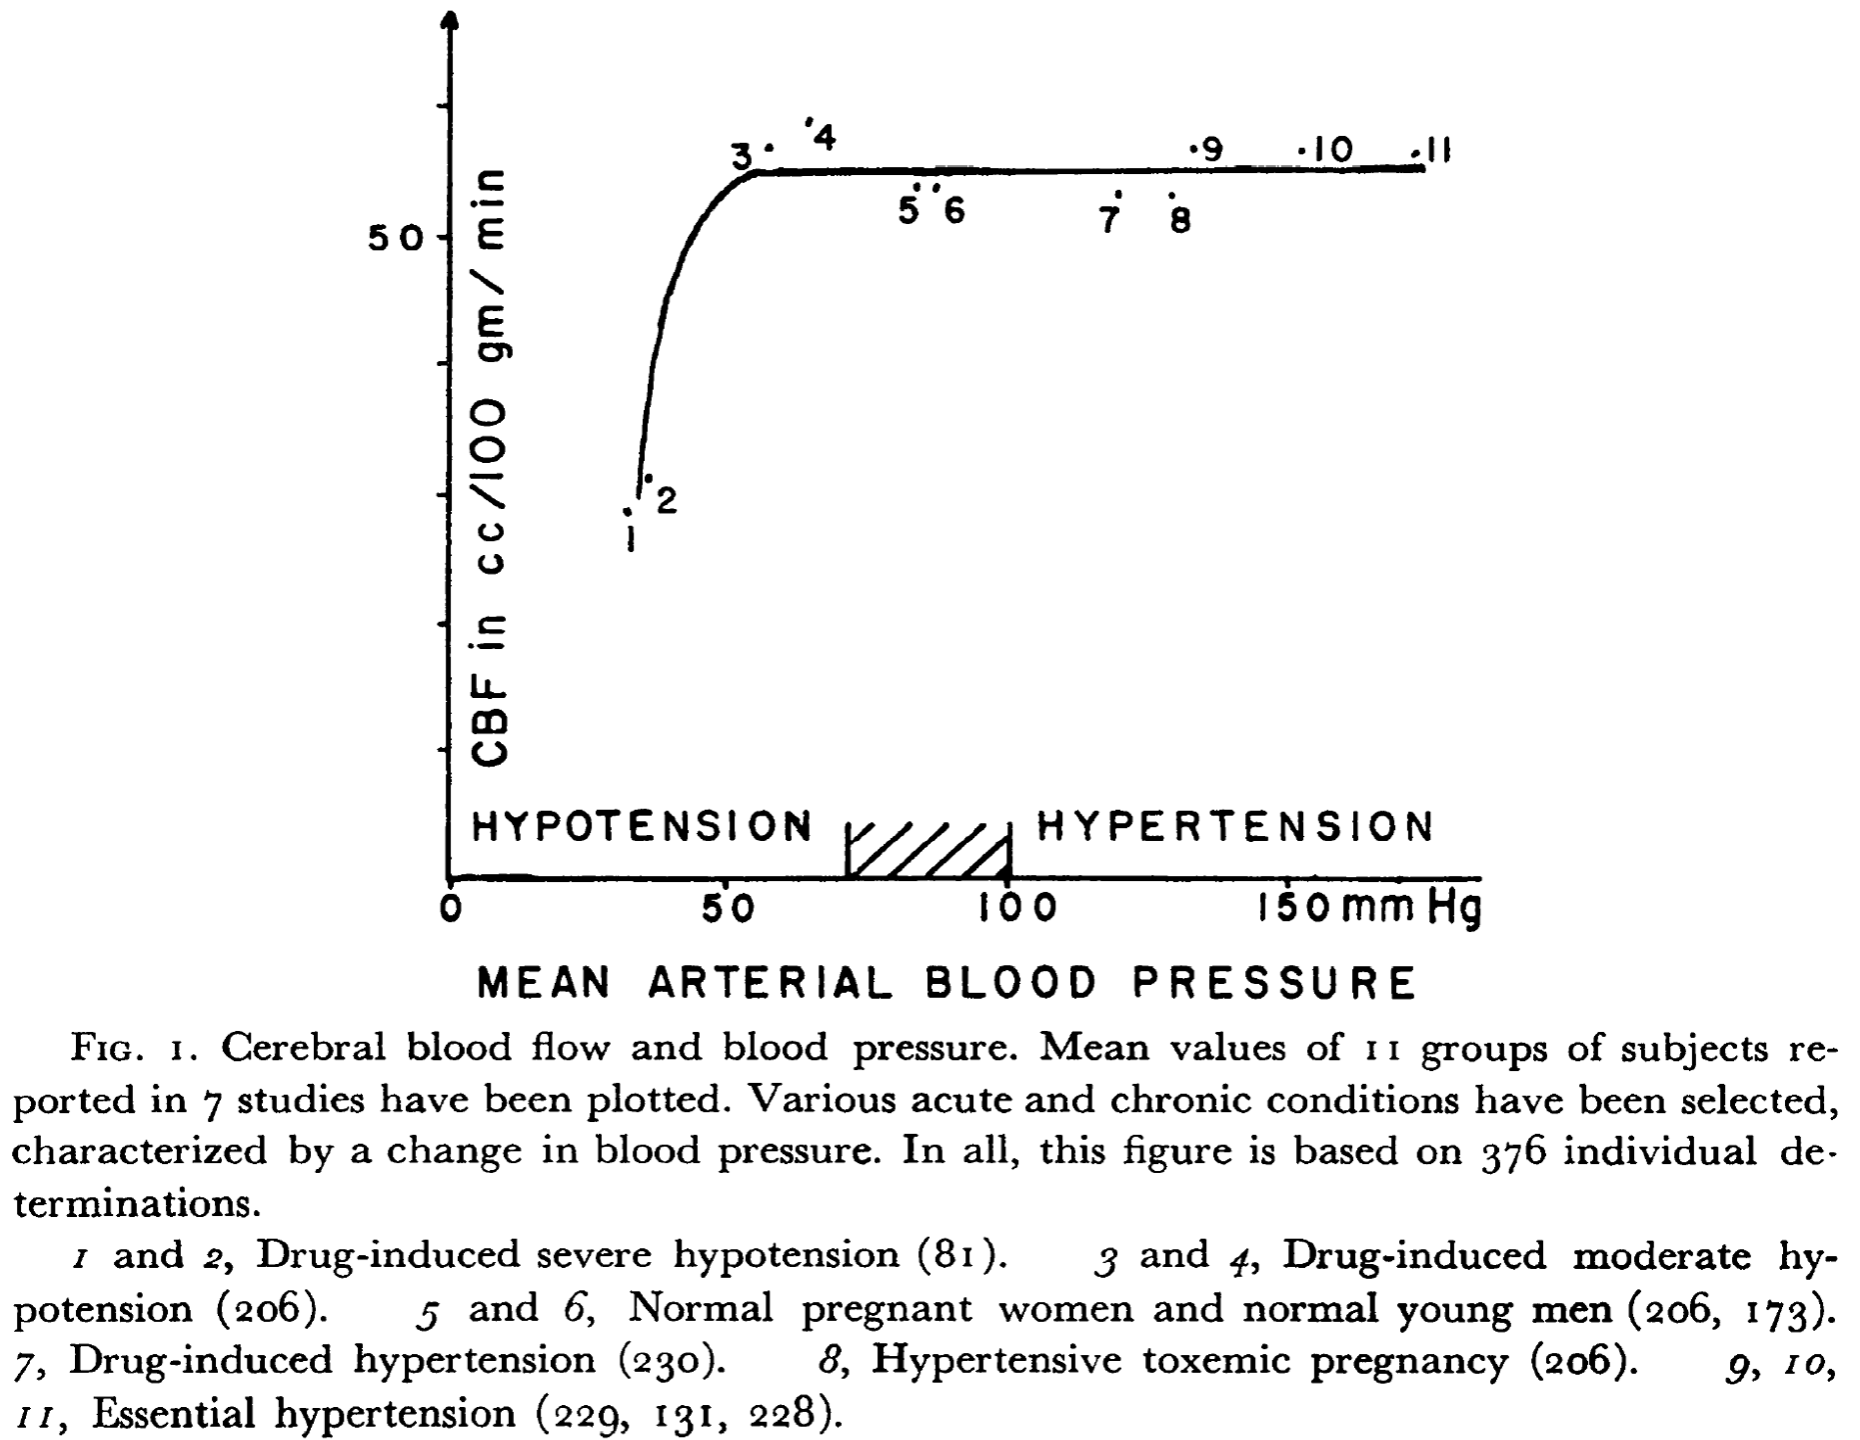
Cerebral Autoregulation is the tendency of cerebral blood flow to remain constant over a broad range of arterial blood pressures. The concept was introduced by Lassen in 1959. Cerebral auto regulation was thought to be an exclusive property of the brain but later other organs (e.g. the kidney) were shown to display similar behavior in response to fluctuations in blood pressure.
Both the brain as well as the kidney are organs quite capable of influencing systemic blood pressure by humoral and for the brain neural pathways.
Where cerebral blood flow remains constant over a broad range of arterial blood pressures, it is highly sensitive to changes in pCO2 (or pH). Cerebral blood flow steeply decreases during hyperventilation and increases during CO2-retention. This is called the metabolic response and is present loco-regionally within brain tissue. For instance, this response makes it possible to generate functional images by BOLD-MRI: brain regions that are active during a certain task will show vasodilatation causing local hyperemia whereas inactive brain regions decrease their blood supply. Again, metabolic coupling is not exclusive to the brain but most likely a property more widespread in body tissues.
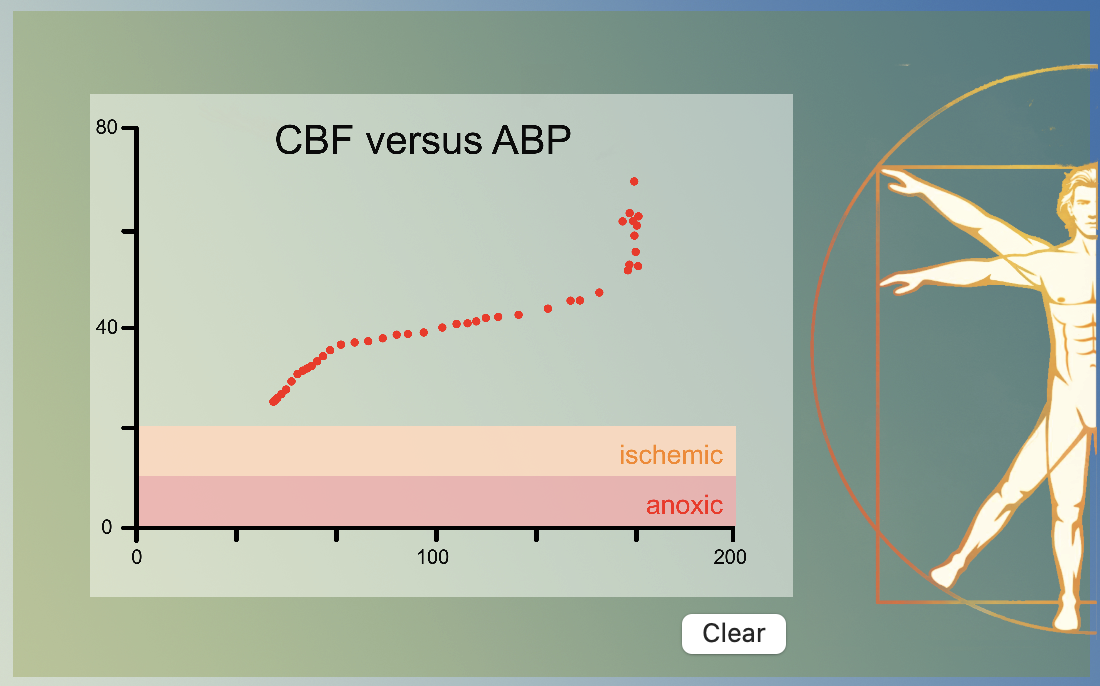
The cardiovascular model combines metabolic coupling and cerebral auto regulation to a single concept: at low blood pressures the resulting hypoperfusion causes an increase in regional CO2 leading tot arteriolar vasodilatation and at high blood pressures hyper perfusion leads to a decrease in regional CO2 an thus vasoconstriction. The above graph was obtained by varying the blood pressure through variation in venous capacitance.
Cardiovascular regulation depends on pressure regulation (via baroceptors) and on chemoregulation (via chemoceptors). Chemoregulation ensures adequate blood concentrations of oxygen (O2) and of carbon dioxide (CO2). The regulation of CO2 is very important for acid-base equilibrium in blood as well as tissue.
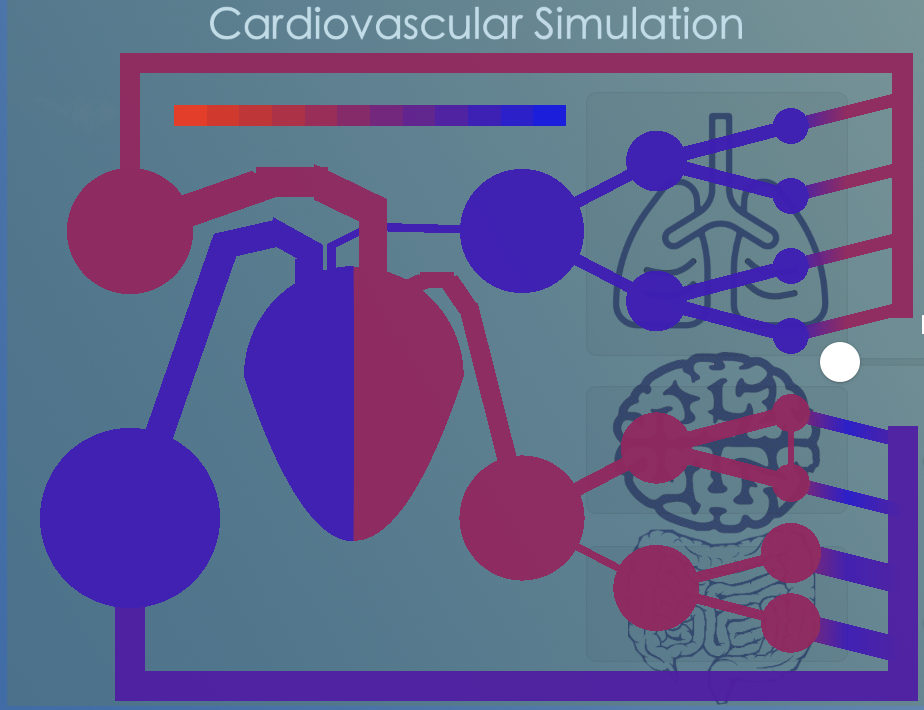
In the model we chose a single waste product called 'CO2' as simulated vector for chemoregulation. CO2 is produced in the tissues, transported by the blood to the lungs, where it is removed. For this, the model does a bookkeeping of the amount of CO2-molecules per volume in all the simulated capacitances. The concentration is graphically illustrated by changing the color of the model capacitances and resistances. In brief:
CO2-production
In the model CO2 is produced by the brain hemispheres as well as by the rest of the body. There are sliders to vary the metabolic rate expressed as the amount of CO2 molecules produced per unit of time.
The formula is: amount (mol) = slider metabolic rate (mol/s) x timestep (s)
The calculated amount is added to the molecules already present (inflow concentration) to calculate the outflow concentration.
CO2-transport
After calculating the blood flow in l/s from one capacitance to the next the amount of CO2 molecules transferred between both capacitances can be calculated from:
amount (mol) = flow (l/s) x concentration (mol/l) x timestep (s)
The volume of the receiving capacitance is increased with flow (l/s) x timestep (s) and the concentration can be calculated by adding the amount of molecules transferred to the amount of molecules already present in the receiving capacitance. Than the concentration is calculated by dividing the total amount by the total volume.
CO2-removal
The amount of CO2 removed from the blood in the lungs can be set by the slider for respiration rate. Increasing this slider will cause a more rapid variation in heart rate (see Cardiac arrhythmia) but also the refresh CO2 fraction: this is the fraction of all CO2 molecules in the inflow that is removed. In formula
amount (mol) = refresh CO2 fraction x inflow concentration (mol/l) x inflow (l/s) x timestep (s)
Then the outflow concentration can be calculated by subtracting the amount removed from the amount already present divided by the outflow.
CO2 color scale
The CO2 color scale is based upon the CO2 concentration in mol/l. It becomes bright red when the CO2 concentration is zero and bright blue when it is larger than 1.66 mmol/l (or in CO2 pressure ≥ 7.2 kPa).
![]()

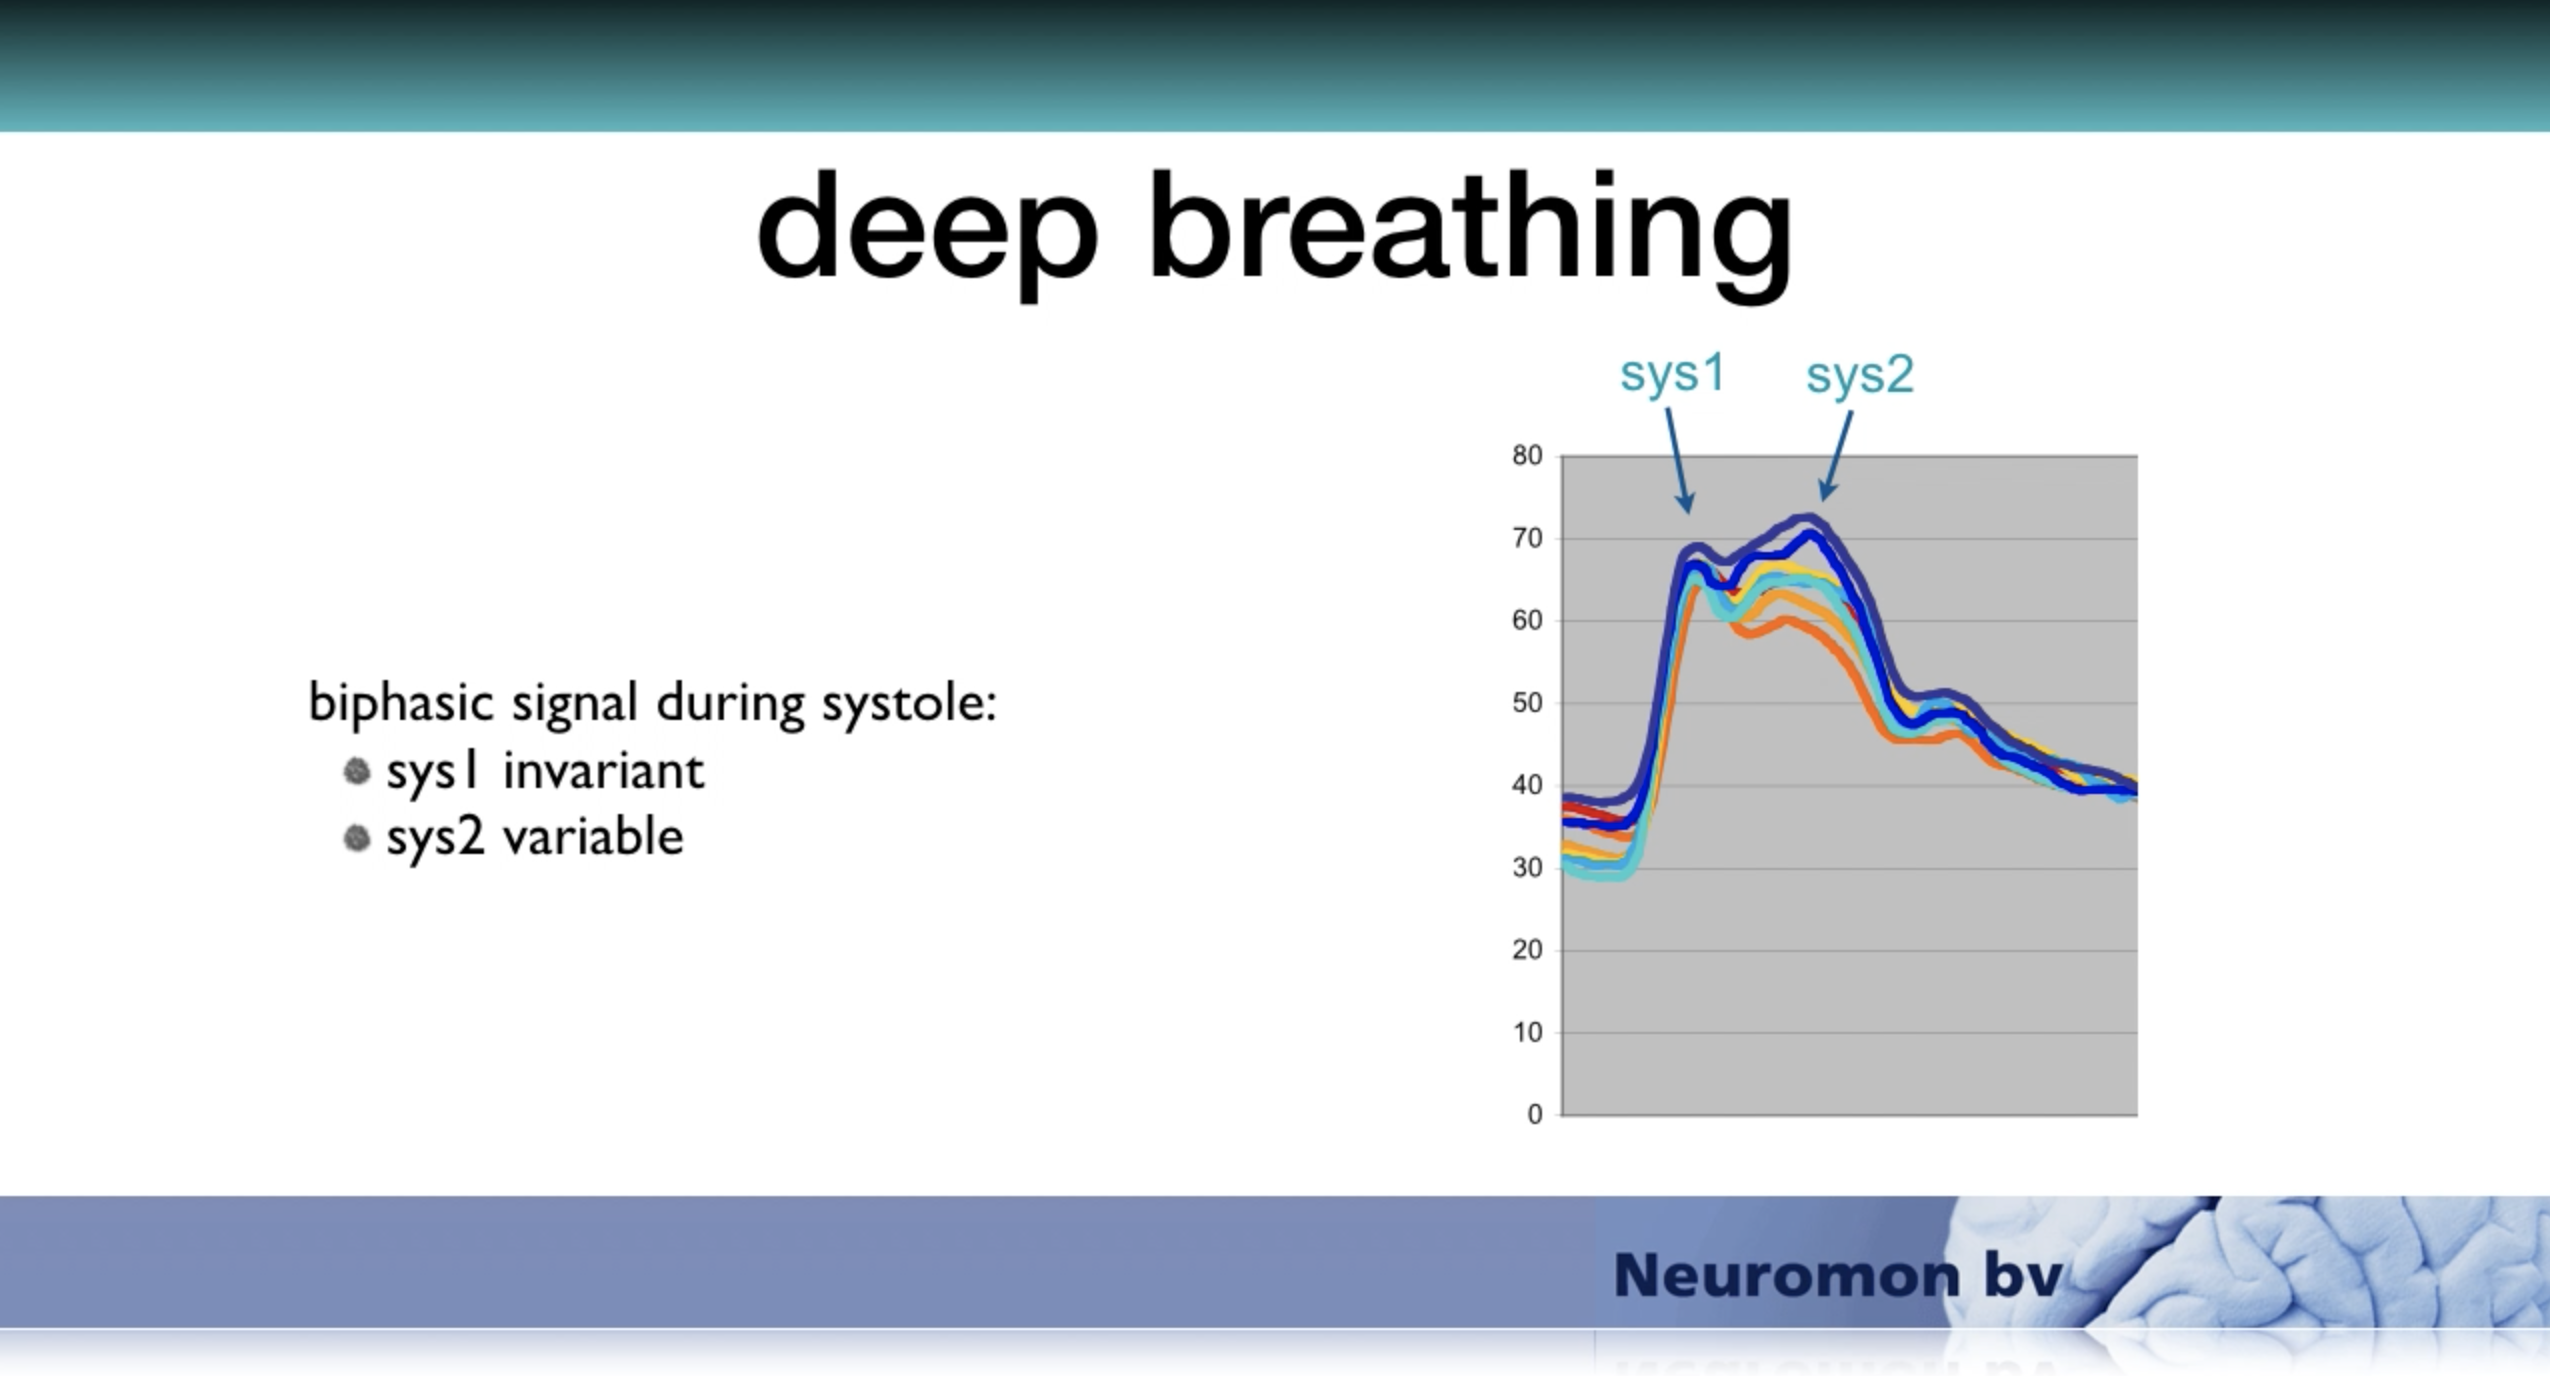
The model works with a user-defined average heart rate in beats per minute (BPM). It simulates cardiac arrhythmia of normal breathing by varying the heart rate sinusoidally following the respiration frequency that can also be selected by the user in cycles per minute (CPM). The maximal variation is defined as percentage of the selected mean heart rate and can be set between 0 and 30%. Because the duration of diastole varies with heart rate the filling time varies and so will the stroke volume. This results in variation of the Sys2 but not the Sys1 component since the amplitude of the Sys1 depends on the strength of arterial acceleration and on the end diastolic blood pressure of the former heart beat whereas the amplitude of the Sys2 component depends on the stroke volume of the current heart beat. Respiratory variation of the difference between Sys1 and Sys2 during, for instance, deep breathing has often been demonstrated in real-life registrations.
Alternatively, the model simulates atrial fibrillation by generating random variation of the heart rate around the selected mean. The generated variation is distributed evenly around the mean.

According to the theory of arterial acceleration, the pressure increase at stroke onset elicits stretch induced depolarization of the smooth muscle cells within the conducting arteries of the arterial tree. Smooth muscle cells have been shown sensitive to stretch. They are arranged circularly (not longitudinally as in the gut) and contain gap junctions in abundance, making them an electronic syncytium. A depolarization at the aortic notch with spread along the arterial tree from proximal to distal as a peristaltic wave. Since this depolarization is assumed short lasting and is triggered by the first increase of pressure at stroke onset, it is assumed not to interfere with the ejection phase of the heart.
The timing of the arterial acceleration in the model is dependent on a sufficiently rapid rise of pressure in one of the arterial capacitances at the left side. Its effect is simulated as a brief reduction in the model's capacitances occurring simultaneously in the triggered capacitance and in those further downstream. The model does not simulate the peristaltic wave from proximal to distal that the theory of arterial acceleration assumes.
The amount of capacitance reduction can be set by a slider at the bottom left of the main screen. The minimal reduction is set to 0% and the maximal reduction to 20%. The reduction in capacitance is applied as a sine function over the so-called acceleration time. The acceleration time varies with the strength of the acceleration selected between 60 and 180 ms.
-
IAG

In 2007 Neuromon BV was supported by a grant from the Innovative Action Programme Groningen and the EU.
-
Eureka label

For it's innovative work and collaboration with international partners Neuromon B.V. received the Eureka! label from the EU
-
Collaboration

To the benefit of patients on the Intensive Care Neuromon B.V. has joined forces with Compumedics DWL.